rusterize on Python
rusterize is designed to work on all shapely geometries, even when they are nested inside complex geometry collections. Functionally, it supports four input types:
- geopandas GeoDataFrame and GeoSeries
- polars-st GeoDataFrame
- Python list of geometries in shapely.Geometry, WKB, or WKT format
- Numpy array of geometries in shapely.Geometry, WKB, or WKT format
It returns a xarray, a numpy, or a custom sparse array in COOrdinate format.
Installation
rusterize comes with numpy as the only required dependency and is distributed in different flavors. A core library that performs the rasterization and returns
a bare numpy array, a xarray flavor that returns a georeferenced xarray (requires xarray and rioxarray and is the recommended flavor), or an all flavor with
dependencies for all supported inputs.
Install the current version with pip:
# core library
pip install rusterize

# xarray capabilities
pip install 'rusterize[xarray]'

# support all input types
pip install 'rusterize[all]'
Usage
Visit the full API reference.
from rusterize import rusterize
import geopandas as gpd
from shapely import wkt
import matplotlib.pyplot as plt
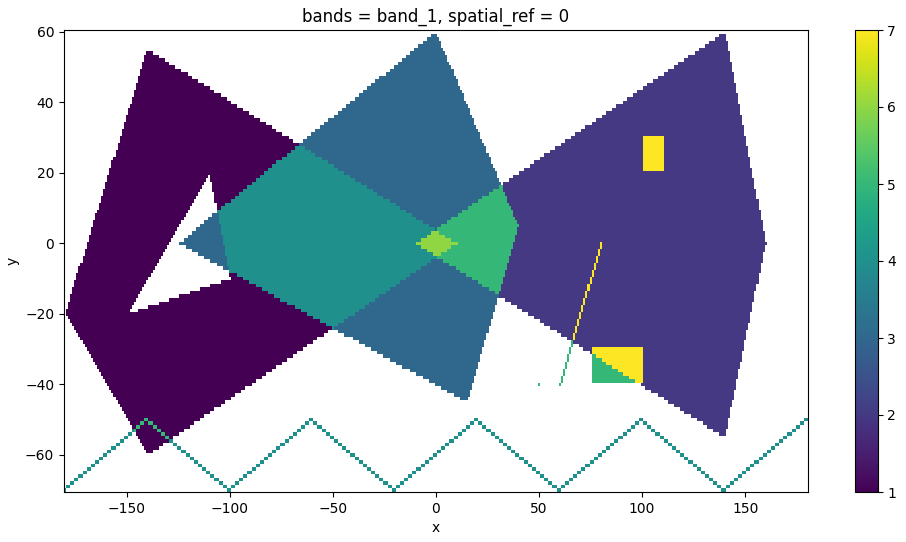
# construct geometries
geoms = [
"POLYGON ((-180 -20, -140 55, 10 0, -140 -60, -180 -20), (-150 -20, -100 -10, -110 20, -150 -20))",
"POLYGON ((-10 0, 140 60, 160 0, 140 -55, -10 0))",
"POLYGON ((-125 0, 0 60, 40 5, 15 -45, -125 0))",
"MULTILINESTRING ((-180 -70, -140 -50), (-140 -50, -100 -70), (-100 -70, -60 -50), (-60 -50, -20 -70), (-20 -70, 20 -50), (20 -50, 60 -70), (60 -70, 100 -50), (100 -50, 140 -70), (140 -70, 180 -50))",
"GEOMETRYCOLLECTION (POINT (50 -40), POLYGON ((75 -40, 75 -30, 100 -30, 100 -40, 75 -40)), LINESTRING (60 -40, 80 0), GEOMETRYCOLLECTION (POLYGON ((100 20, 100 30, 110 30, 110 20, 100 20))))"
]
# create a GeoDataFrame with shapely geometries from WKT
gdf = gpd.GeoDataFrame({'value': range(1, len(geoms) + 1)}, geometry=wkt.loads(geoms), crs='EPSG:32619')
output = rusterize(
gdf,
res=(1, 1),
field="value",
fun="sum",
).squeeze()
# plot it
fig, ax = plt.subplots(figsize=(12, 6))
output.plot.imshow(ax=ax)
plt.show()
You could also create a multiband output by specifing the by parameter.
gdf["by"] = ["a", "a", "b", "b", "c"]

output = rusterize(
    gdf,
    res=(1, 1),
    field="value",
    by="by",
    fun="sum",
)
Alternatively, you can pass raw values to burn on the final raster, one per geometry.
import numpy as np

output = rusterize(
    geoms,
    res=(1, 1),
    fun="sum",
    burn=np.arange(1, len(geoms) + 1)
).squeeze()
Finally, you can also create a SparseArray, that is an object storing the band/row/col value triplets of all pixels that will be materialized in a final raster.
output = rusterize(
    gdf,
    res=(1, 1),
    field="value",
    fun="sum",
    encoding="sparse"
)
output
# SparseArray:
# - Shape: (131, 361)
# - Extent: (-180.5, -70.5, 180.5, 60.5)
# - Resolution: (1.0, 1.0)
# - EPSG: 32619
# - Estimated size: 378.33 KB

# materialize into xarray or numpy
array = output.to_xarray()
array = output.to_numpy()

# get only coordinates and values
output.to_frame()
# shape: (29_363, 3)
# ┌─────┬─────┬────────┐
# │ row ┆ col ┆ values │
# │ --- ┆ --- ┆ ---    │
# │ u64 ┆ u64 ┆ f64    │
# ╞═════╪═════╪════════╡
# │ 6   ┆ 40  ┆ 1.0    │
# │ 6   ┆ 41  ┆ 1.0    │
# │ 6   ┆ 42  ┆ 1.0    │
# │ 7   ┆ 39  ┆ 1.0    │
# │ 7   ┆ 40  ┆ 1.0    │
# │ …   ┆ …   ┆ …      │
# │ 39  ┆ 286 ┆ 5.0    │
# │ 39  ┆ 287 ┆ 5.0    │
# │ 39  ┆ 288 ┆ 5.0    │
# │ 39  ┆ 289 ┆ 5.0    │
# │ 39  ┆ 290 ┆ 5.0    │
# └─────┴─────┴────────┘
Contributing
Any contribution is welcome! You can install rusterize directly from this repo using maturin as an editable package.
For this to work, you’ll need to have Rust and cargo installed.
To run the tests you need to have gdal installed as well as the rusterize[all] flavor.
# clone repo
git clone https://github.com/<username>/rusterize.git
cd rusterize

# install Rust nightly toolchain
rustup toolchain install nightly-2026-04-01

# create a virtual environment (e.g. using `uv`)
# install maturin
uv pip install maturin

# install editable version with optmized code
maturin develop --profile dist-release --uv

# test the new contribution
pytest
Benchmarks
rusterize is fast! Let’s try it on small and large datasets in comparison to GDAL (benchmark_rusterize.py). You can run this with pytest and pytest-benchmark:
pytest <python file> --benchmark-min-rounds=10 --benchmark-time-unit='s'

--------------------------------------------- benchmark: 8 tests -------------------------------------------------
Name (time in s)               Min     Max    Mean  StdDev  Median     IQR  Outliers       OPS  Rounds  Iterations
------------------------------------------------------------------------------------------------------------------
test_water_small_f64_numpy  0.0038  0.0045  0.0040  0.0001  0.0040  0.0002      56;3  248.7981     181           1
test_water_small_f64        0.0048  0.0057  0.0050  0.0001  0.0050  0.0001      21;9  198.8759     158           1
test_water_small_gdal_f64   0.0053  0.0057  0.0054  0.0001  0.0054  0.0001     28;14  184.3595     160           1
test_water_large_f64_numpy  1.2628  1.3610  1.3133  0.0314  1.3193  0.0498       5;0    0.7614      10           1
test_water_large_f64        1.2762  1.4723  1.3342  0.0628  1.3149  0.0165       2;4    0.7495      10           1
test_water_large_gdal_f64   1.4128  1.4229  1.4178  0.0029  1.4180  0.0040       3;0    0.7053      10           1
test_roads_uint8            3.3184  3.5184  3.4021  0.0578  3.3849  0.0527       3;1    0.2939      10           1
test_roads_gdal_uint8       9.0672  9.1040  9.0901  0.0109  9.0920  0.0125       2;0    0.1100      10           1
------------------------------------------------------------------------------------------------------------------
And fasterize (benchmark_fasterize.r). Note that it doesn't support custom dtype so the returning raster is float64.
Unit: seconds
            expr              min           lq        mean       median          uq         max neval
 fasterize_small_f64   0.05764281   0.06274373   0.1286875   0.06520358   0.1128432   0.6000182    10
 fasterize_large_f64  36.91321005  37.71877265  41.0140303  40.81343803  43.9201820  46.5596799    10
Comparison with other tools
While rusterize is fast, there are other fast alternatives out there, including rasterio and geocube. However, rusterize allows for a seamless,
Rust-native processing with similar or lower memory footprint that does not require you to install GDAL and returns the geoinformation you need for downstream
processing with ample control over resolution, shape, extent, and data type.
The following is a time comparison of 10 runs (median) on the same large water bodies dataset used earlier (dtype is float64) (run_others.py).
rusterize: 1.3 sec
rasterio:  14.5 sec
geocube:   124.9 sec